背景
动态捕捉到服务内部在处理请求时的方法级别调用链路信息。
调研了一下,比较常见的APM开源工具有以下几种:
| 工具 | 解释 | 缺陷 |
| Arthas | 阿里开源。trace命令使用通配符能够获取到方法调用链路,利用watch命令能够查看方法的出入参 | 当类或方法太多时,耗时很长,而且方法体太大时会报错 |
| SkyWalking | Apache开源项目。 | 关注的是分布式之间的调用链路。虽然可以使用插件增强,但是效果不明显。。。 |
| pinpoint | 韩国团队开源项目。 | 部署比较复杂 |
以上工具均能实现在对代码无侵入的情况下,对链路进行追踪。
原理
目前市面上无侵入的服务监控工具其底层是使用JavaAgent技术,JavaAgent是一种特殊的Java程序,它不能独立的运行,智能依附于主程序启动,通过代理的方式能够与JVM进行交互,获取到主程序运行中的信息。
部署要求
pinpoint
- pinpoint-agent-3.0.0.tar.gz (监控探针)
- apache-pinot-1.1.0-bin.tar.gz (pinpoint依赖的存储组件)
- hbase-2.6.0-bin.tar.gz (pinpoint数据存储)
- pinpoint-collector-starter-3.0.0-exec.jar (pinpoint数据收集器)
- pinpoint-web-starter-3.0.0-exec.jar (pinpoint提供的web服务)
环境
JDK21(不推荐17以下的版本),查看Java版本
java -version
# 需要设置JAVA_HOME
vim /etc/profile
# 在末尾添加
export JAVA_HOME=/usr/local/jdk-21.0.4
export PATH=$JAVA_HOME/bin:$PATH
export CLASSPATH=.:$JAVA_HOME/lib/dt.jar:$JAVA_HOME/lib/tools.jarLinux CentOS7 (CentOS版本必须大于6,因为glibc版本必须大于等于2.14,CentOS7默认glibc版本2.17,千万不要作死自己升级glibc版本)
Redis服务(确保在6379端口监听)
端口
需要开放16010(hbase)、9991、9992、9993(这三个是collector使用的)、8080(这个是pinpoint-web访问端口),9000(pinot)、2123、19092端口
部署
启动hbase
进入hbase的bin目录下执行以下命令,会提示master running,查看输出的日志,没有报错即可。
./start-hbase.sh获取hbase针对pinpoint的初始化文件
wget https://github.com/pinpoint-apm/pinpoint/blob/master/hbase/scripts/hbase-create.hbasebin目录下执行:
./hbase shell path/to/your/hbase-create.hbase控制台会输出提示信息,建了一些表。
可以使用./hbase shell命令,进入hbase控制台,输入list来查看已经创建的表。之后collector收集的相关数据会以二进制的形式存储在hbase。
pinot
快速启动
在pinot的bin目录下,使用以下命令快速启动pinot,查看logs目录下的日志,zookeeper,pinot minion,pinot broker,pinot server都启动了,快速启动会创建一些表,并且会自己执行查询命令检查可用性。注意这里zookeper监听2123端口
./pinot-admin.sh QuickStart -type batch日志中输出下面的内容就没问题了。
You can always go to http://localhost:9000 to play around in the query consolepinpoint依赖Kafka组件,使用如下命令来启动Kafka,监听19092端口
./pinot-admin.sh StartKafka -zkAddress=localhost:2123/kafka -port 19092自己也可以开额外的kafka,不清楚支持哪个版本的kafka,本人试过容易报错,不推荐。
创建Schame和Table
接下来是在pinot创建Schame和Table。可以使用http访问9000端口,使用swagger API创建。这里考虑到在linux上部署,不便访问。可以使用下面的curl命令直接创建,按照顺序依次执行即可。命令执行成功后控制台会输出success响应。
- Schame
# 1
curl --location 'http://localhost:9000/schemas' \
--header 'Content-Type: application/json' \
--data '{
    "schemaName": "inspectorStatAgent00",
    "dimensionFieldSpecs": [
        {
            "name": "tenantId",
            "dataType": "STRING",
            "defaultNullValue": ""
        },
        {
            "name": "serviceName",
            "dataType": "STRING",
            "defaultNullValue": ""
        },
        {
            "name": "sortKey",
            "dataType": "STRING",
            "defaultNullValue": ""
        },
        {
            "name": "applicationName",
            "dataType": "STRING",
            "defaultNullValue": ""
        },
        {
            "name": "agentId",
            "dataType": "STRING"
        },
        {
            "name": "metricName",
            "dataType": "STRING"
        },
        {
            "name": "fieldName",
            "dataType": "STRING"
        },
        {
            "name": "version",
            "dataType": "STRING",
            "defaultNullValue": ""
        },
        {
            "name": "tags",
            "dataType": "STRING",
            "singleValueField": false,
            "defaultNullValue": "null"
        }
    ],
    "metricFieldSpecs": [
        {
            "name": "fieldValue",
            "dataType": "DOUBLE",
            "defaultNullValue": -1.0
        }
    ],
    "dateTimeFieldSpecs": [
        {
            "name": "eventTime",
            "dataType": "TIMESTAMP",
            "format": "1:MILLISECONDS:EPOCH",
            "granularity": "1:MILLISECONDS"
        }
    ]
}'

# 2
curl --location 'http://localhost:9000/schemas' \
--header 'Content-Type: application/json' \
--data '{
    "schemaName": "inspectorStatApp",
    "dimensionFieldSpecs": [
        {
            "name": "tenantId",
            "dataType": "STRING",
            "defaultNullValue": ""
        },
        {
            "name": "serviceName",
            "dataType": "STRING",
            "defaultNullValue": ""
        },
        {
            "name": "sortKey",
            "dataType": "STRING",
            "defaultNullValue": ""
        },
        {
            "name": "applicationName",
            "dataType": "STRING"
        },
        {
            "name": "metricName",
            "dataType": "STRING"
        },
        {
            "name": "fieldName",
            "dataType": "STRING"
        },
        {
            "name": "version",
            "dataType": "STRING",
            "defaultNullValue": ""
        },
        {
            "name": "primaryTag",
            "dataType": "STRING",
            "defaultNullValue": ""
        }
    ],
    "metricFieldSpecs": [
        {
            "name": "sumFieldValue",
            "dataType": "DOUBLE",
            "defaultNullValue": 0
        },
        {
            "name": "minFieldValue",
            "dataType": "DOUBLE",
            "defaultNullValue": 0
        },
        {
            "name": "maxFieldValue",
            "dataType": "DOUBLE",
            "defaultNullValue": 0
        },
        {
            "name": "countFieldValue",
            "dataType": "INT",
            "defaultNullValue": 0
        }
    ],
    "dateTimeFieldSpecs": [
        {
            "name": "roundedEventTime",
            "dataType": "TIMESTAMP",
            "format": "1:MILLISECONDS:EPOCH",
            "granularity": "1:MILLISECONDS"
        }
    ]
}'

# 3
curl --location 'http://localhost:9000/schemas' \
--header 'Content-Type: application/json' \
--data '{
    "schemaName": "systemMetricDataType",
    "dimensionFieldSpecs": [
        {
            "name": "metricName",
            "dataType": "STRING"
        },
        {
            "name": "fieldName",
            "dataType": "STRING"
        },
        {
            "name": "dataType",
            "dataType": "INT"
        }
    ],
    "dateTimeFieldSpecs": [
        {
            "name": "saveTime",
            "dataType": "TIMESTAMP",
            "format": "1:MILLISECONDS:EPOCH",
            "granularity": "1:MILLISECONDS"
        }
    ],
    "primaryKeyColumns": [
        "metricName",
        "fieldName"
    ]
}'

# 4
curl --location 'http://localhost:9000/schemas' \
--header 'Content-Type: application/json' \
--data '{
    "schemaName": "systemMetricDouble",
    "dimensionFieldSpecs": [
        {
            "name": "tenantId",
            "dataType": "STRING",
            "defaultNullValue": ""
        },
        {
            "name": "serviceName",
            "dataType": "STRING",
            "defaultNullValue": ""
        },
        {
            "name": "hostGroupName",
            "dataType": "STRING"
        },
        {
            "name": "hostName",
            "dataType": "STRING"
        },
        {
            "name": "metricName",
            "dataType": "STRING"
        },
        {
            "name": "fieldName",
            "dataType": "STRING"
        },
        {
            "name": "tags",
            "dataType": "STRING",
            "singleValueField": false,
            "defaultNullValue": "null"
        },
        {
            "name": "version",
            "dataType": "STRING",
            "defaultNullValue": ""
        }
    ],
    "metricFieldSpecs": [
        {
            "name": "fieldValue",
            "dataType": "DOUBLE",
            "defaultNullValue": -1.0
        }
    ],
    "dateTimeFieldSpecs": [
        {
            "name": "eventTime",
            "dataType": "TIMESTAMP",
            "format": "1:MILLISECONDS:EPOCH",
            "granularity": "1:MILLISECONDS"
        }
    ]
}'

# 5
curl --location 'http://localhost:9000/schemas' \
--header 'Content-Type: application/json' \
--data '{
    "schemaName": "systemMetricTag",
    "dimensionFieldSpecs": [
        {
            "name": "tenantId",
            "dataType": "STRING",
            "defaultNullValue": ""
        },
        {
            "name": "serviceName",
            "dataType": "STRING",
            "defaultNullValue": ""
        },
        {
            "name": "hostGroupName",
            "dataType": "STRING"
        },
        {
            "name": "hostName",
            "dataType": "STRING"
        },
        {
            "name": "metricName",
            "dataType": "STRING"
        },
        {
            "name": "fieldName",
            "dataType": "STRING"
        },
        {
            "name": "tags",
            "dataType": "STRING",
            "defaultNullValue": "{}"
        }
    ],
    "dateTimeFieldSpecs": [
        {
            "name": "saveTime",
            "dataType": "TIMESTAMP",
            "format": "1:MILLISECONDS:EPOCH",
            "granularity": "1:MILLISECONDS"
        }
    ],
    "primaryKeyColumns": [
        "tenantId",
        "serviceName",
        "hostGroupName",
        "hostName",
        "metricName",
        "fieldName",
        "tags"
    ]
}'

# 6
curl --location 'http://localhost:9000/schemas' \
--header 'Content-Type: application/json' \
--data '{
    "schemaName": "uriStat",
    "dimensionFieldSpecs": [
        {
            "name": "tenantId",
            "dataType": "STRING",
            "defaultNullValue": ""
        },
        {
            "name": "serviceName",
            "dataType": "STRING",
            "defaultNullValue": ""
        },
        {
            "name": "applicationName",
            "dataType": "STRING"
        },
        {
            "name": "agentId",
            "dataType": "STRING"
        },
        {
            "name": "uri",
            "dataType": "STRING"
        },
        {
            "name": "version",
            "dataType": "INT"
        }
    ],
    "metricFieldSpecs": [
        {
            "name": "apdexRaw",
            "dataType": "DOUBLE"
        },
        {
            "name": "count",
            "dataType": "LONG"
        },
        {
            "name": "failureCount",
            "dataType": "LONG"
        },
        {
            "name": "maxLatencyMs",
            "dataType": "LONG"
        },
        {
            "name": "totalTimeMs",
            "dataType": "LONG"
        },
        {
            "name": "tot0",
            "dataType": "INT"
        },
        {
            "name": "tot1",
            "dataType": "INT"
        },
        {
            "name": "tot2",
            "dataType": "INT"
        },
        {
            "name": "tot3",
            "dataType": "INT"
        },
        {
            "name": "tot4",
            "dataType": "INT"
        },
        {
            "name": "tot5",
            "dataType": "INT"
        },
        {
            "name": "tot6",
            "dataType": "INT"
        },
        {
            "name": "tot7",
            "dataType": "INT"
        },
        {
            "name": "fail0",
            "dataType": "INT"
        },
        {
            "name": "fail1",
            "dataType": "INT"
        },
        {
            "name": "fail2",
            "dataType": "INT"
        },
        {
            "name": "fail3",
            "dataType": "INT"
        },
        {
            "name": "fail4",
            "dataType": "INT"
        },
        {
            "name": "fail5",
            "dataType": "INT"
        },
        {
            "name": "fail6",
            "dataType": "INT"
        },
        {
            "name": "fail7",
            "dataType": "INT"
        }
    ],
    "dateTimeFieldSpecs": [
        {
            "name": "timestamp",
            "dataType": "LONG",
            "format": "1:MILLISECONDS:EPOCH",
            "granularity": "1:MILLISECONDS"
        }
    ]
}'

# 7
curl --location 'http://localhost:9000/schemas' \
--header 'Content-Type: application/json' \
--data '{
    "schemaName": "exceptionTrace",
    "dimensionFieldSpecs": [
        {
            "name": "tenantId",
            "dataType": "STRING"
        },
        {
            "name": "transactionId",
            "dataType": "STRING"
        },
        {
            "name": "spanId",
            "dataType": "LONG"
        },
        {
            "name": "exceptionId",
            "dataType": "LONG"
        },
        {
            "name": "applicationServiceType",
            "dataType": "STRING"
        },
        {
            "name": "applicationName",
            "dataType": "STRING"
        },
        {
            "name": "agentId",
            "dataType": "STRING"
        },
        {
            "name": "uriTemplate",
            "dataType": "STRING"
        },
        {
            "name": "errorClassName",
            "dataType": "STRING"
        },
        {
            "name": "errorMessage_logtype",
            "dataType": "STRING",
            "maxLength": 2147483647
        },
        {
            "name": "errorMessage_encodedVars",
            "dataType": "LONG",
            "singleValueField": false
        },
        {
            "name": "errorMessage_dictionaryVars",
            "dataType": "STRING",
            "singleValueField": false,
            "maxLength": 2147483647
        },
        {
            "name": "exceptionDepth",
            "dataType": "INT"
        },
        {
            "name": "stackTraceClassName",
            "dataType": "STRING",
            "singleValueField": false
        },
        {
            "name": "stackTraceFileName",
            "dataType": "STRING",
            "singleValueField": false
        },
        {
            "name": "stackTraceLineNumber",
            "dataType": "INT",
            "singleValueField": false
        },
        {
            "name": "stackTraceMethodName",
            "dataType": "STRING",
            "singleValueField": false
        },
        {
            "name": "stackTraceHash",
            "dataType": "BYTES"
        }
    ],
    "dateTimeFieldSpecs": [
        {
            "name": "timestamp",
            "dataType": "TIMESTAMP",
            "format": "1:MILLISECONDS:EPOCH",
            "granularity": "1:MILLISECONDS"
        }
    ]
}'- Table
需要注意的是:
replicasPerPartition这个字段,如果按照上面的方式启动就是1,不用动,如果是自己启动的Kafka,需要按照自己的配置填写。
stream.kafka.broker.list这个字段注意后面的端口是Kafka监听的端口,可以按需更改,如果是按照上面的方式来的,不用动,直接执行。
# 1
curl --location 'http://localhost:9000/tables' \
--header 'Content-Type: application/json' \
--data '{
  "tableName": "inspectorStatAgent00",
  "tableType": "REALTIME",
  "segmentsConfig": {
    "timeColumnName": "eventTime",
    "timeType": "MILLISECONDS",
    "schemaName": "inspectorStatAgent00",
    "replicasPerPartition": "1",
    "retentionTimeUnit": "DAYS",
    "retentionTimeValue": "7"
  },
  "tenants": {},
  "tableIndexConfig": {
    "sortedColumn": ["sortKey"],
    "bloomFilterColumns": ["tenantId", "serviceName", "sortKey", "applicationName", "agentId", "metricName", "fieldName"],
    "noDictionaryColumns": ["fieldValue", "eventTime"],
    "segmentPartitionConfig": {
      "columnPartitionMap": {
        "sortKey": {
          "functionName": "Murmur",
          "numPartitions": 32
        }
      }
    },
    "loadMode": "MMAP",
    "nullHandlingEnabled": true,
    "streamConfigs": {
      "streamType": "kafka",
      "stream.kafka.consumer.type": "lowlevel",
      "stream.kafka.topic.name": "inspector-stat-agent-00",
      "stream.kafka.decoder.class.name": "org.apache.pinot.plugin.stream.kafka.KafkaJSONMessageDecoder",
      "stream.kafka.consumer.factory.class.name": "org.apache.pinot.plugin.stream.kafka20.KafkaConsumerFactory",
      "stream.kafka.broker.list": "localhost:19092",
      "realtime.segment.flush.threshold.rows": "0",
      "realtime.segment.flush.threshold.time": "24h",
      "realtime.segment.flush.threshold.segment.size": "64M",
      "stream.kafka.consumer.prop.auto.offset.reset": "smallest"
    }
  },
  "metadata": {
    "customConfigs": {}
  },
  "task": {
    "taskTypeConfigsMap": {
      "RealtimeToOfflineSegmentsTask": {
        "bucketTimePeriod": "4h",
        "bufferTimePeriod": "12h",
        "schedule": "0 0/10 * * * ?",
        "maxNumRecordsPerSegment": "6000000"
      }
    }
  },
  "routing": {
    "segmentPrunerTypes": [
      "time",
      "partition"
    ]
  }
}'

# 2
curl --location 'http://localhost:9000/tables' \
--header 'Content-Type: application/json' \
--data '{
  "tableName": "inspectorStatApp",
  "tableType": "REALTIME",
  "query" : {
    "disableGroovy": false
  },
  "segmentsConfig": {
    "timeColumnName": "roundedEventTime",
    "timeType": "MILLISECONDS",
    "schemaName": "inspectorStatApp",
    "replicasPerPartition": "1",
    "retentionTimeUnit": "DAYS",
    "retentionTimeValue": "7"
  },
  "tenants": {},
  "tableIndexConfig": {
    "sortedColumn": ["sortKey"],
    "bloomFilterColumns": ["tenantId", "serviceName", "sortKey", "applicationName", "metricName", "fieldName", "version", "primaryTag"],
    "noDictionaryColumns": ["sumFieldValue", "minFieldValue", "maxFieldValue", "countFieldValue"],
    "segmentPartitionConfig": {
      "columnPartitionMap": {
        "sortKey": {
          "functionName": "Murmur",
          "numPartitions": 64
        }
      }
    },
    "loadMode": "MMAP",
    "nullHandlingEnabled": true,
    "streamConfigs": {
      "streamType": "kafka",
      "stream.kafka.consumer.type": "lowlevel",
      "stream.kafka.topic.name": "inspector-stat-app",
      "stream.kafka.decoder.class.name": "org.apache.pinot.plugin.stream.kafka.KafkaJSONMessageDecoder",
      "stream.kafka.consumer.factory.class.name": "org.apache.pinot.plugin.stream.kafka20.KafkaConsumerFactory",
      "stream.kafka.broker.list": "localhost:19092",
      "realtime.segment.flush.threshold.rows": "0",
      "realtime.segment.flush.threshold.time": "24h",
      "realtime.segment.flush.threshold.segment.size": "64M",
      "stream.kafka.consumer.prop.auto.offset.reset": "smallest"
    }
  },
  "ingestionConfig": {
    "transformConfigs": [
      {
        "columnName": "roundedEventTime",
        "transformFunction": "DATETIME_CONVERT(eventTime, '\''1:MILLISECONDS:EPOCH'\'', '\''1:MILLISECONDS:EPOCH'\'', '\''30:SECONDS'\'')"
      }
    ],
    "aggregationConfigs": [
      {
        "columnName": "sumFieldValue",
        "aggregationFunction": "SUM(fieldValue)"
      },
      {
        "columnName": "minFieldValue",
        "aggregationFunction": "MIN(fieldValue)"
      },
      {
        "columnName": "maxFieldValue",
        "aggregationFunction": "MAX(fieldValue)"
      },
      {
        "columnName": "countFieldValue",
        "aggregationFunction": "COUNT(*)"
      }
    ]
  },
  "metadata": {
    "customConfigs": {}
  },
  "routing": {
    "segmentPrunerTypes": [
      "time",
      "partition"
    ]
  }
}'

# 3
curl --location 'http://localhost:9000/tables' \
--header 'Content-Type: application/json' \
--data '{
  "tableName": "systemMetricDataType",
  "tableType": "REALTIME",
  "segmentsConfig": {
    "timeColumnName": "saveTime",
    "timeType": "MILLISECONDS",
    "schemaName": "systemMetricDataType",
    "replicasPerPartition": "1",
    "retentionTimeUnit": "DAYS",
    "retentionTimeValue": "70"
  },
  "tenants": {},
  "tableIndexConfig": {
    "sortedColumn": ["metricName"],
    "loadMode": "MMAP",
    "nullHandlingEnabled": true,
    "streamConfigs": {
      "streamType": "kafka",
      "stream.kafka.consumer.type": "lowlevel",
      "stream.kafka.topic.name": "system-metric-data-type",
      "stream.kafka.decoder.class.name": "org.apache.pinot.plugin.stream.kafka.KafkaJSONMessageDecoder",
      "stream.kafka.consumer.factory.class.name": "org.apache.pinot.plugin.stream.kafka20.KafkaConsumerFactory",
      "stream.kafka.broker.list": "localhost:19092",
      "realtime.segment.flush.threshold.rows": "0",
      "realtime.segment.flush.threshold.time": "24h",
      "realtime.segment.flush.threshold.segment.size": "64M",
      "stream.kafka.consumer.prop.auto.offset.reset": "smallest"
    }
  },
  "metadata": {
    "customConfigs": {}
  },
  "routing": {
    "instanceSelectorType": "strictReplicaGroup"
  },
  "upsertConfig": {
    "mode": "FULL"
  }
}'

# 4
curl --location 'http://localhost:9000/tables' \
--header 'Content-Type: application/json' \
--data '{
  "tableName": "systemMetricDouble",
  "tableType": "REALTIME",
  "segmentsConfig": {
    "timeColumnName": "eventTime",
    "timeType": "MILLISECONDS",
    "schemaName": "systemMetricDouble",
    "replicasPerPartition": "1",
    "retentionTimeUnit": "DAYS",
    "retentionTimeValue": "7"
  },
  "tenants": {},
  "tableIndexConfig": {
    "sortedColumn": ["hostName"],
    "bloomFilterColumns": ["tenantId", "serviceName", "hostGroupName", "hostName", "metricName", "fieldName"],
    "noDictionaryColumns": ["fieldValue", "eventTime"],
    "loadMode": "MMAP",
    "nullHandlingEnabled": true,
    "streamConfigs": {
      "streamType": "kafka",
      "stream.kafka.consumer.type": "lowlevel",
      "stream.kafka.topic.name": "system-metric-double",
      "stream.kafka.decoder.class.name": "org.apache.pinot.plugin.stream.kafka.KafkaJSONMessageDecoder",
      "stream.kafka.consumer.factory.class.name": "org.apache.pinot.plugin.stream.kafka20.KafkaConsumerFactory",
      "stream.kafka.broker.list": "localhost:19092",
      "realtime.segment.flush.threshold.rows": "0",
      "realtime.segment.flush.threshold.time": "24h",
      "realtime.segment.flush.threshold.segment.size": "64M",
      "stream.kafka.consumer.prop.auto.offset.reset": "smallest"
    }
  },
  "metadata": {
    "customConfigs": {}
  },
  "task": {
    "taskTypeConfigsMap": {
      "RealtimeToOfflineSegmentsTask": {
        "bucketTimePeriod": "4h",
        "bufferTimePeriod": "12h",
        "schedule": "0 0 * * * ?",
        "maxNumRecordsPerSegment": "6000000"
      }
    }
  },
  "routing": {
    "segmentPrunerTypes": [
      "time"
    ]
  }
}'

# 5
curl --location 'http://localhost:9000/tables' \
--header 'Content-Type: application/json' \
--data '{
  "tableName": "systemMetricTag",
  "tableType": "REALTIME",
  "segmentsConfig": {
    "timeColumnName": "saveTime",
    "timeType": "MILLISECONDS",
    "schemaName": "systemMetricTag",
    "replicasPerPartition": "1",
    "retentionTimeUnit": "DAYS",
    "retentionTimeValue": "70"
  },
  "tenants": {},
  "tableIndexConfig": {
    "sortedColumn": ["hostName"],
    "loadMode": "MMAP",
    "nullHandlingEnabled": true,
    "streamConfigs": {
      "streamType": "kafka",
      "stream.kafka.consumer.type": "lowlevel",
      "stream.kafka.topic.name": "system-metric-tag",
      "stream.kafka.decoder.class.name": "org.apache.pinot.plugin.stream.kafka.KafkaJSONMessageDecoder",
      "stream.kafka.consumer.factory.class.name": "org.apache.pinot.plugin.stream.kafka20.KafkaConsumerFactory",
      "stream.kafka.broker.list": "localhost:19092",
      "realtime.segment.flush.threshold.rows": "0",
      "realtime.segment.flush.threshold.time": "24h",
      "realtime.segment.flush.threshold.segment.size": "64M",
      "stream.kafka.consumer.prop.auto.offset.reset": "smallest"
    }
  },
  "metadata": {
    "customConfigs": {}
  },
  "routing": {
    "instanceSelectorType": "strictReplicaGroup"
  },
  "upsertConfig": {
    "mode": "FULL"
  }
}'

# 6
curl --location 'http://localhost:9000/tables' \
--header 'Content-Type: application/json' \
--data '{
  "tableName": "uriStat",
  "tableType": "REALTIME",
  "segmentsConfig": {
    "timeColumnName": "timestamp",
    "timeType": "MILLISECONDS",
    "schemaName": "uriStat",
    "replicasPerPartition": "1",
    "retentionTimeUnit": "DAYS",
    "retentionTimeValue": "7"
  },
  "tenants": {},
  "tableIndexConfig": {
    "sortedColumn": ["applicationName"],
    "bloomFilterColumns": ["tenantId", "serviceName", "applicationName", "agentId"],
    "noDictionaryColumns": ["tot0", "tot1", "tot2", "tot3", "tot4", "tot5", "tot6", "tot7", "fail0", "fail1", "fail2", "fail3", "fail4", "fail5", "fail6", "fail7"],
    "loadMode": "MMAP",
    "nullHandlingEnabled": true,
    "streamConfigs": {
      "streamType": "kafka",
      "stream.kafka.consumer.type": "lowlevel",
      "stream.kafka.topic.name": "url-stat",
      "stream.kafka.decoder.class.name": "org.apache.pinot.plugin.stream.kafka.KafkaJSONMessageDecoder",
      "stream.kafka.consumer.factory.class.name": "org.apache.pinot.plugin.stream.kafka20.KafkaConsumerFactory",
      "stream.kafka.broker.list": "localhost:19092",
      "realtime.segment.flush.threshold.rows": "0",
      "realtime.segment.flush.threshold.time": "24h",
      "realtime.segment.flush.threshold.segment.size": "64M",
      "stream.kafka.consumer.prop.auto.offset.reset": "smallest"
    },
    "segmentPartitionConfig": {
      "columnPartitionMap": {
        "applicationName": {
          "functionName": "Murmur",
          "numPartitions": 64
        }
      }
    }
  },
  "task": {
    "taskTypeConfigsMap": {
      "RealtimeToOfflineSegmentsTask": {
        "bucketTimePeriod": "4h",
        "bufferTimePeriod": "12h",
        "schedule": "0 0 * * * ?",
        "maxNumRecordsPerSegment": "1000000"
      }
    }
  },
  "routing": {
    "segmentPrunerTypes": [
      "time",
      "partition"
    ]
  },
  "metadata": {
  }
}'

# 7
curl --location 'http://localhost:9000/tables' \
--data '{
  "tableName": "exceptionTrace",
  "tableType": "REALTIME",
  "segmentsConfig": {
    "schemaName": "exceptionTrace",
    "retentionTimeUnit": "DAYS",
    "retentionTimeValue": "28",
    "replicasPerPartition": "1",
    "minimizeDataMovement": false,
    "timeColumnName": "timestamp"
  },
  "tenants": {
    "broker": "DefaultTenant",
    "server": "DefaultTenant",
    "tagOverrideConfig": {}
  },
  "tableIndexConfig": {
    "invertedIndexColumns": [],
    "noDictionaryColumns": [
      "timestamp",
      "transactionId",
      "spanId",
      "exceptionId",
      "exceptionDepth"
    ],
    "streamConfigs": {
      "streamType": "kafka",
      "stream.kafka.topic.name": "exception-trace",
      "stream.kafka.broker.list": "localhost:19092",
      "stream.kafka.consumer.type": "lowlevel",
      "stream.kafka.consumer.prop.auto.offset.reset": "smallest",
      "stream.kafka.consumer.factory.class.name": "org.apache.pinot.plugin.stream.kafka20.KafkaConsumerFactory",
      "stream.kafka.decoder.class.name": "org.apache.pinot.plugin.inputformat.clplog.CLPLogMessageDecoder",
      "realtime.segment.flush.threshold.rows": "0",
      "realtime.segment.flush.threshold.time": "24h",
      "realtime.segment.flush.threshold.segment.size": "100M",
      "stream.kafka.decoder.prop.fieldsForClpEncoding": "errorMessage"
    },
    "bloomFilterColumns": [
      "agentId"
    ],
    "loadMode": "MMAP",
    "onHeapDictionaryColumns": [],
    "varLengthDictionaryColumns": [
      "errorMessage_logtype",
      "errorMessage_dictionaryVars"
    ],
    "enableDefaultStarTree": false,
    "enableDynamicStarTreeCreation": false,
    "rangeIndexColumns": [],
    "rangeIndexVersion": 2,
    "autoGeneratedInvertedIndex": false,
    "createInvertedIndexDuringSegmentGeneration": false,
    "sortedColumn": [
      "applicationName"
    ],
    "aggregateMetrics": false,
    "nullHandlingEnabled": false,
    "optimizeDictionary": false,
    "optimizeDictionaryForMetrics": false,
    "noDictionarySizeRatioThreshold": 0.85
  },
  "metadata": {},
  "quota": {},
  "task": {
    "taskTypeConfigsMap": {
      "RealtimeToOfflineSegmentsTask": {
        "bucketTimePeriod": "4h",
        "bufferTimePeriod": "12h",
        "schedule": "0 0 * * * ?",
        "maxNumRecordsPerSegment": "1000000"
      }
    }
  },
  "routing": {
    "segmentPrunerTypes": [
      "time"
    ]
  },
  "query": {},
  "fieldConfigList": [],
  "ingestionConfig": {
    "continueOnError": false,
    "rowTimeValueCheck": false,
    "segmentTimeValueCheck": true
  },
  "isDimTable": false
}'启动Collector和Web
起两个配置文件,与collector和web的jar包目录中。
- collector-starter-application.yml
pinpoint:
  zookeeper:
    address: localhost
  metric:
    kafka:
      bootstrap:
        servers: localhost:19092
spring:
  pinot-datasource:
    pinot:
      jdbc-url: jdbc:pinot://localhost:9000
- web-starter-application.yml
pinpoint:
  zookeeper:
    address: localhost
spring:
  pinot-datasource:
    pinot:
jdbc-url: jdbc:pinot://localhost:9000启动Collector和web,在logs目录下查看日志,没有报错的话,访问8080端口就能看到servermap界面了。
java -jar -Dspring.config.additional-location=collector-starter-application.yml pinpoint-collector-starter-3.0.0-exec.jar
java -jar -Dspring.config.additional-location=web-starter-application.yml pinpoint-web-starter-3.0.0-exec.jarAgent监控主服务
使用agent来监控某个服务,并将收集到的信息上报给collector即可实现服务监控。
配置agent
agent目录下共有三个配置文件,自pinpoint2.X版本后,默认使用的配置文件是profile/release/pinpoint.config。需要修改的地方主要有:
- 修改collector服务器的IP地址
- 修改采样率,流量不大的情况下,建议采样率100%,否则有些流量录制不到
# 配置collector地址
profiler.transport.grpc.collector.ip=你的collector所在的服务器地址
# if it's COUNTING(the default), then 1 out of n transactions will be sampled where n is the rate.
# eg. 1: 100%     20: 5%     50: 2%      100: 1%
profiler.sampling.counting.sampling-rate=1
# @Deprecate : Alias for profiler.sampling.counting.sampling-rate
#profiler.sampling.rate=20

# if it's PERCENT, then first x transactions out of y transactions will be sampled.
# Support from 100% to 0.01%
# eg. 100: 100%    50: 50%   5: 5%  0.01: 0.01%
profiler.sampling.percent.sampling-rate=100启动Agent
在原服务启动的命令上加入java agent的命令,指定你的java agent路径,需要注意Dpinpoint.agentId是唯一的,Dpinpoint.applicationName这个可以填你的服务名称。
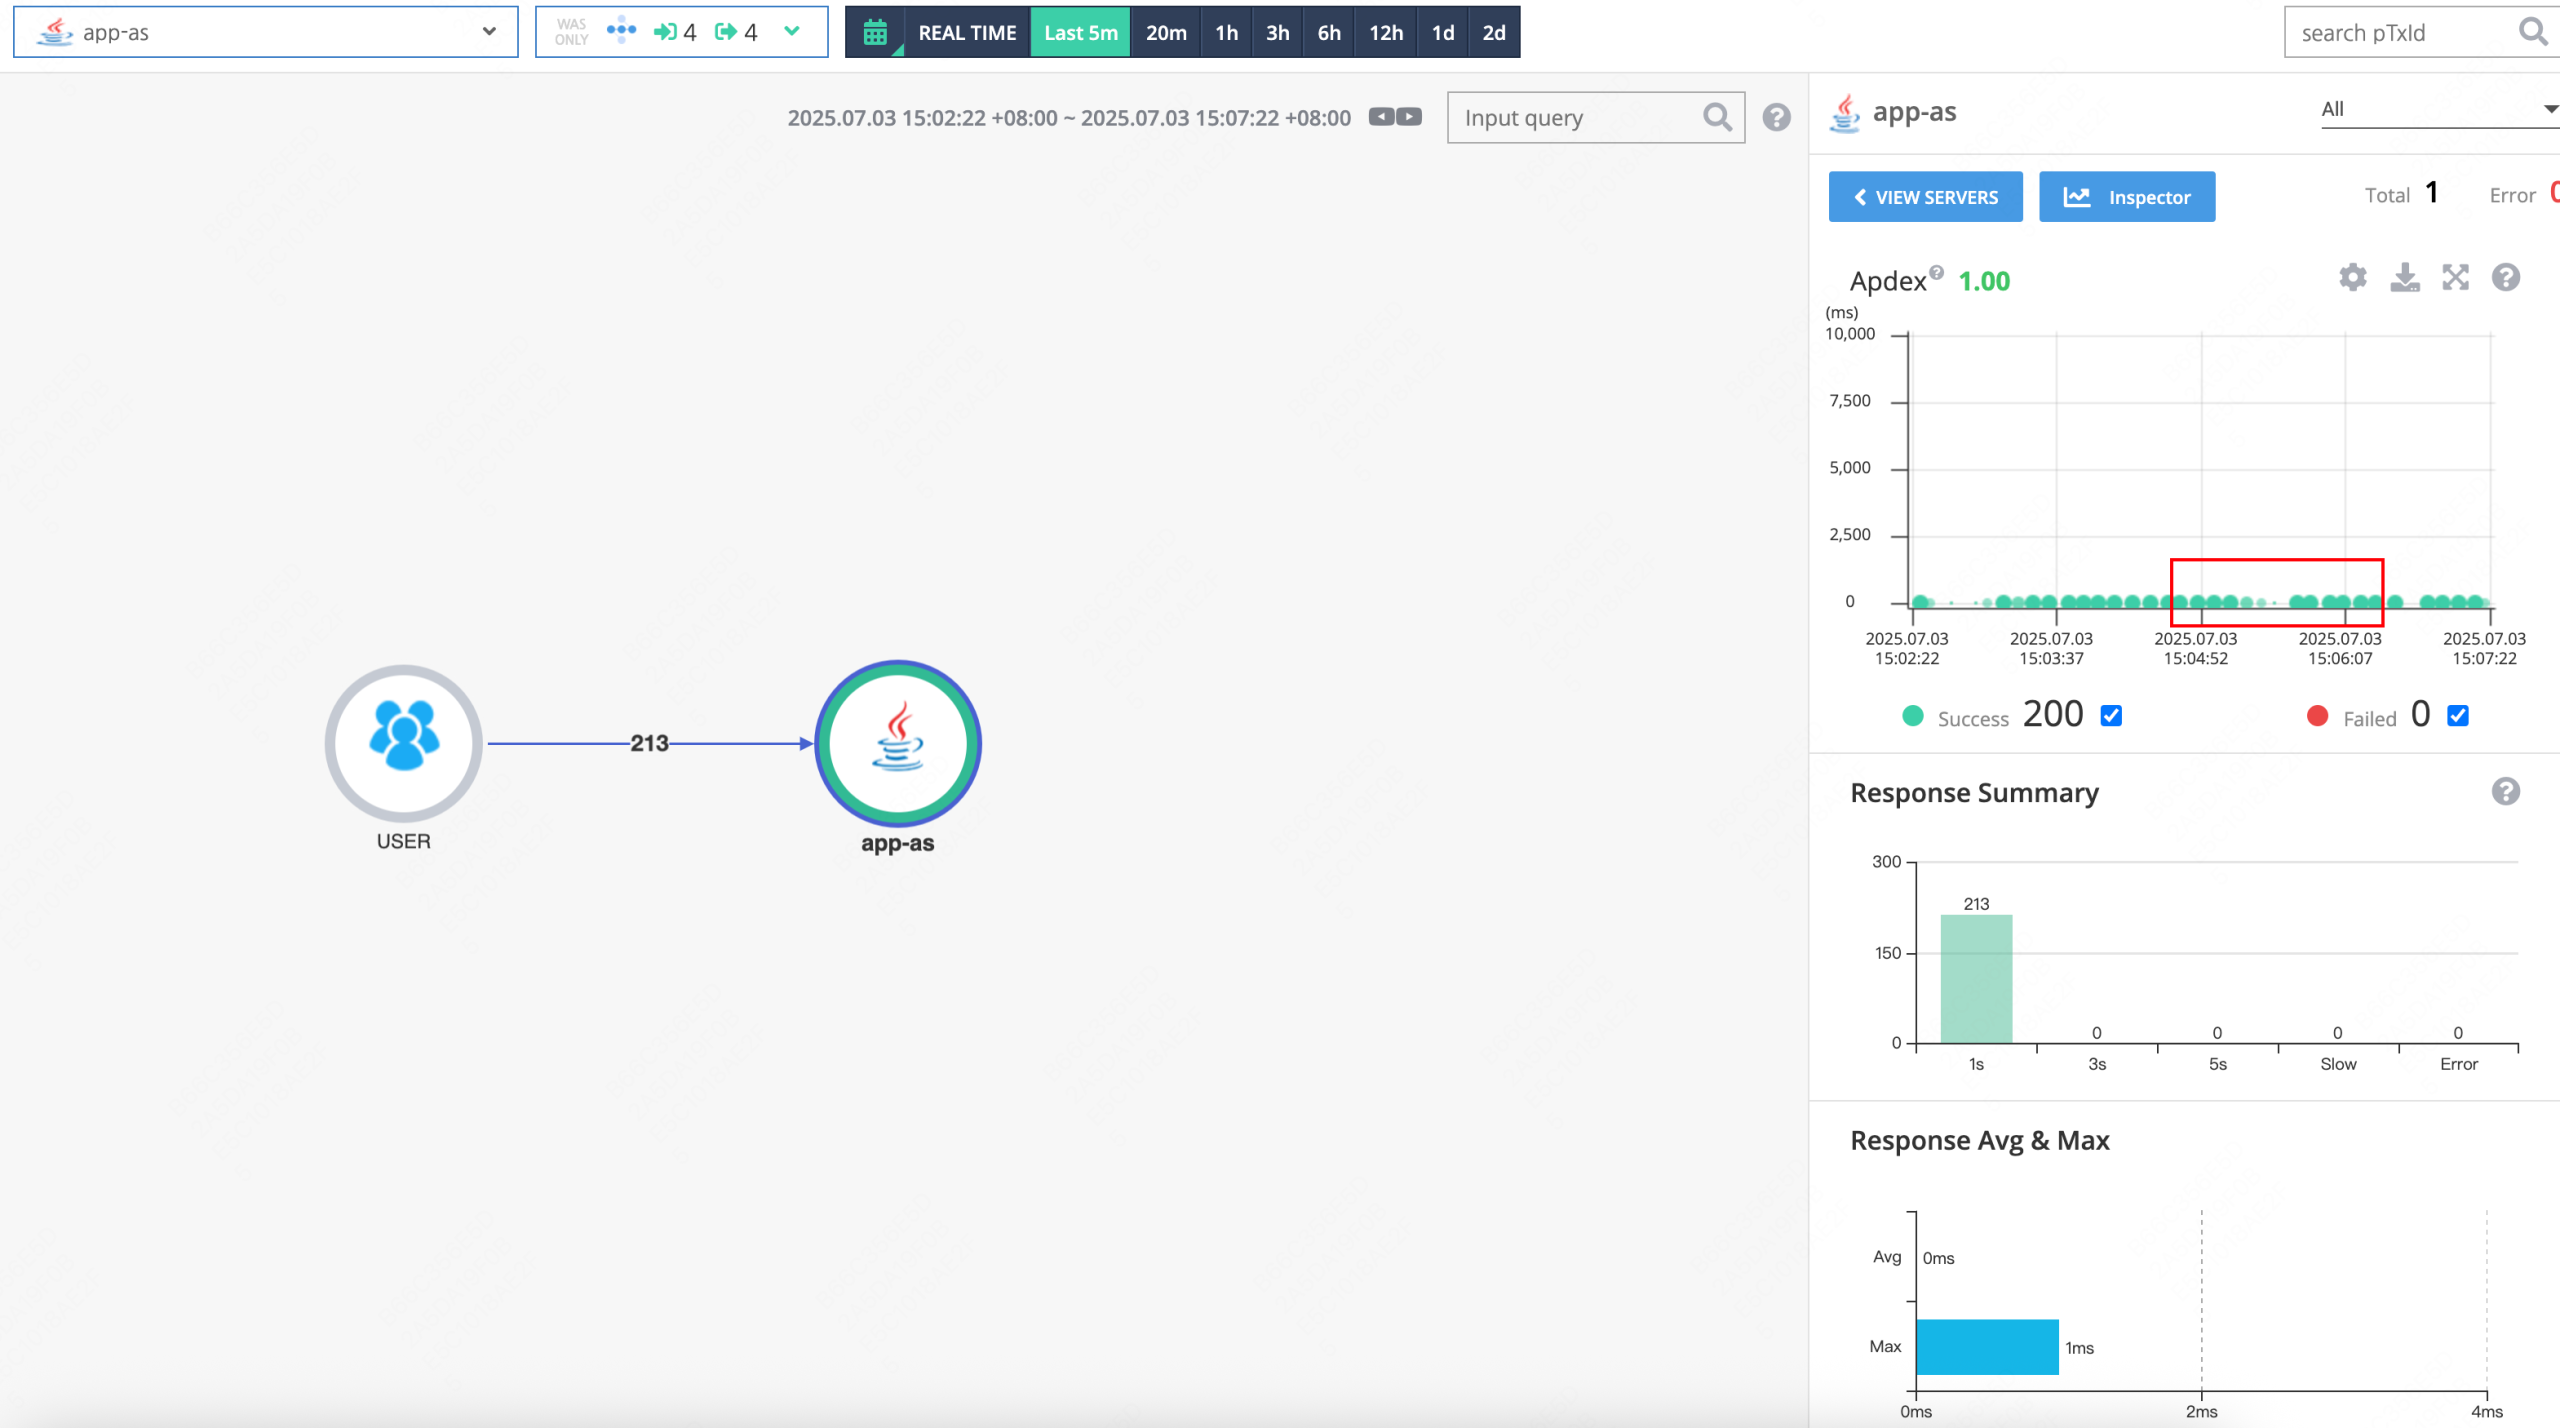
java -javaagent:path/to/your/pinpoint-agent/pinpoint-bootstrap-{$VERSION}.jar -Dpinpoint.agentId=xxx -Dpinpoint.applicationName=xxx -jar 你的服务jar包再访问pinpoint web界面,可以看到有流量的打点,还有方法调用栈。
Pinpoint API
Pinpoint官方文档上声明不对外提供API,但是在版本不变更的情况下还是能够抓到一些API的,方便我们实现自动化的链路追踪
主要有:
- 查询pinpoint配置
[GET]http://IP:8080/configuration.pinpoint
- 查询监控的应用信息
[GET]http://IP:8080/applications.pinpoint- 查询serverMap,具体的参数抓包看一下或者用postman测试一下
[GET]http://IP:8080/getServerMapDataV2.pinpoint?applicationName=rviceTypeName=&from=&to=&calleeRange=&callerRange=&wasOnly=&bidirectional=&useStatisticsAgentState=- 查询打点,即上图中流量的打点。主要方便后续拿到流量的 TraceId,有了TraceId就能够获取到流量的方法调用链路了。
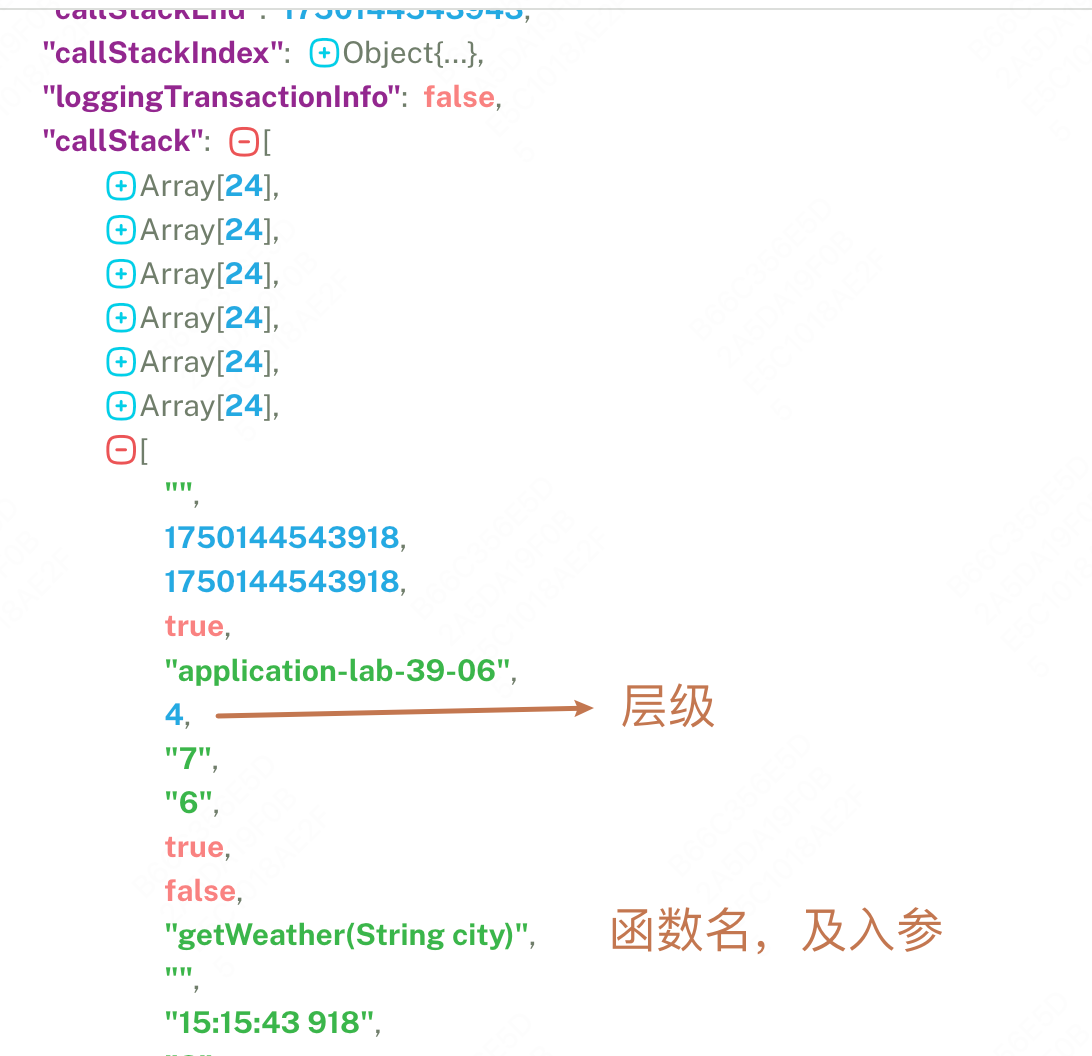
[GET]http://IP:8080/getScatterData.pinpoint?to=&from=&limit=&filter=&application=&xGroupUnit=&yGroupUnit=- 事务查询,根据 TraceId 查询单条流量
[GET]http://IP:8080/pinpoint-web/transactionInfo.pinpoint?traceId=返回结果的 “callStack” 字段记录了单条流量的方法调用链路,包括时间戳、应用名、层级、函数名、入参和返回值、类名等等信息,根据这些信息获取到动态链路就很简单了。在没有递归或者循环调用的情况下,方法调用链路是一颗多叉树,更准确的来说应当是有向无环图
参考链接: